 Online Store
Introduction
Over the last several decades, governments have collectively pledged to slow global warming. But despite intensified diplomacy, the world is already facing the consequences of climate…
Yes, Virginia, the world’s central banks are financing most of the US current account deficit (my rebuttal to Richard Iley)
More on:
Back in the summer of 2004, Nouriel Roubini and I published a paper arguing that large trade deficits implied a deteriorating US net international investment position and a deteriorating “income” balance.
Our analysis was couched in the terms of the debt-sustainability analysis then the rage at the IMF. But it basically made a very simple argument: if you borrow a ton to spend more than you earn, your debts will rise and you will eventually have to start borrowing even more to cover the interest on your debts. And if you cannot borrow ever larger sums, you will have to cut back.
Seems reasonable, right?
Alas, we were wrong. At least our forecasts were wrong. The US has run large deficits ever since we wrote the paper. $640b (revised) in 2004. $755b in 2005. $810b in 2006. Maybe $755b in 2007 (assuming a $190b deficit in q4). That sums up to a bit less than $3 trillion in cumulative deficits. The United States net international investment position hasn’t deteriorated by anything close to $3 trillion. It didn’t actually deteriorate at all between 2003 and 2006 if US FDI abroad is valued at market rates (data). While we don’t yet know the total for 2007, the dollar’s slide should generate another round capital gains on America’s investments in Europe.
The income balance (the difference between the interest and dividends the US receives from the world and what it pays to the world) also has not swung into deficit. Interest payments on US debt are rising. But income on US direct investment abroad has increased faster. The BEA didn't help by revising the income balance up by around $40b when there published their comprehensive data revisions earlier this year. However, the 2007 income surplus looks to be bigger than the 2006 surplus. That isn’t explained by a new method for calculating US interest payments.
Nouriel and I didn’t ignore valuation gains from currency moves. We did though argue that the US couldn’t consistently count on valuation gains from the dollar’s slide to offset large deficit – foreigners would eventually demand an interest rate to compensate them for the risk of dollar depreciation (see Delong). Alas, there is little evidence that happened. And we didn’t consider the possibility than foreign equity markets would consistently outperform US equity markets –
The (revised) bottom line: large US deficits won’t lead to a deterioration in the US net international investment position so long as the US can consistently finance its deficits by selling the world depreciating assets. Or, if not depreciating assets, assets that underperform America's own foreign assets.
To put it in more pithy terms, the US deficit is sustainable – that is, the US won’t pile up unsustainable debts -- so long as the US is not a great place to invest.
That though doesn’t sound right. Running a deficit requires attracting financing. And that usually means offering at least the prospect of a decent return.
Many have argued that the US can basically attract funds no matter what because of the unique safety, integrity and liquidity of US markets. But after the summer of subprime, that description – sadly – no longer rings true.
Treasuries are liquid and even have produced decent returns this year, at least if you ignore currency losses. But the US household deficit, not just the fiscal deficit, needs financing. US residential mortgage backed securities -- and CDOs derived from mortgage-backed securities -- proved neither safe nor liquid.
So how has the US been able to sustain its deficit even as US financial assets underperformed global financial assets – producing big gains for Americans who invested abroad and in some cases large losses for foreigners who invested in the US?
My answer is quite simple: the US has financed its deficit in large part by selling debt to central banks who are forced to buy under-performing US assets as a result of their currency policy. If you shadow the dollar, you have to buy the dollar – no matter how badly the dollar does.
Richard Iley presents a strong critique against this point of view. He argues that I shouldn’t compare net official inflows to net private inflows or to the current account deficit. Rather I should compare gross official inflows to gross private inflows. Relative to the current account deficit, net official inflows are now large (and they are understated in the official data – Ill bore you with the details in a bit). Relative to gross inflows, official inflows are modest.
Ragu Rajan made a version of this argument when he was chief economist at the IMF. Ted Truman – my former boss at the Treasury and a long-time top Fed official – often makes a similar point: it is inaccurate to net official inflows against the current account deficit rather than private outflows, since money is fungible.
This is serious argument, one that deserves a serious response. So apologies for the length of this post.
Let’s start with the actual data.
Here is a graph of private capital flows – gross inflows and gross outflows – over time. The flows are computed as a rolling four quarter, and are scaled to GDP. Unless otherwise state, the data comes from the BEA. 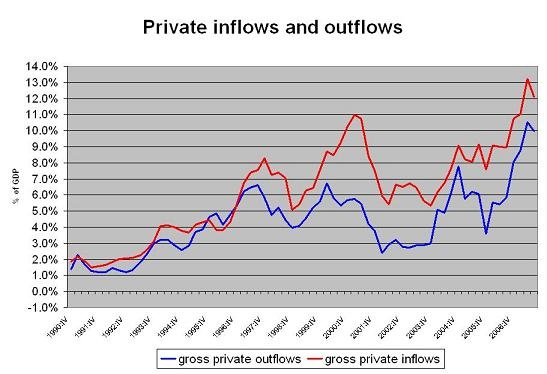
As Richard notes, private flows of all sort are rising relative to US GDP. Mark it down to financial globalization. Americans are more willing to hold foreign assets, foreigners are more willing to hold US assets.
And here is a graph -- on the same scale – of official inflows and outflows over time. The data on global reserves come from the IMF, with Saudi non-reserve central bank assets added in.
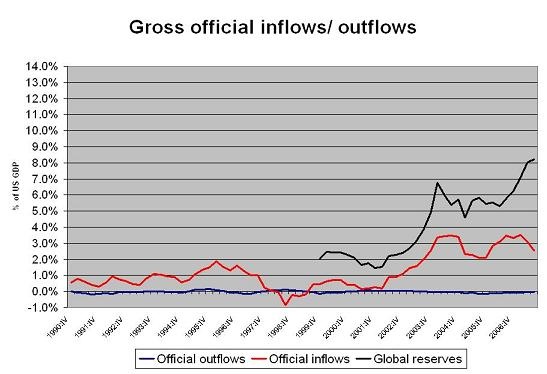
Official inflows to the US are large -- and there are virtually no official outflows from the US, so the net basically tracts gross inflows. But gross official flows are not as large as gross private flows, and over the past few quarters they haven’t increased as fast as private inflows.
Game and set for Iley …
I would offer three points in rebuttal to try to pull out the match:
First, the size of official inflows – particularly over the past five quarters – is systematically understated in the US data. After several years of living with the TIC data, I feel pretty sure of this: I can tell you whose assets are under-counted (China and Russia), why (purchases through London) and give rough magnitudes ($200b plus over the last four quarters). I can also name-drop: Harvard’s Dr Feldstein has reached a similar conclusion. Conversely, private flows – particularly long-term flows – are overstated.
Second, the increase in gross private outflows and inflows has come entirely from an increase in bank claims and other mostly “short-term liabilities reported by non-bank financial institutions. These flows are mostly in dollars and seem to systematically cancel each other out (see the Fed flow of funds data, including table F107, line 15 for net bank lending).
Think of US bank lending in dollars to London, and Caribbean banks lending in dollars to the US and the like. Think of US banks lending to their London SIV to buy short-term US paper. Basically, these flows inflate the gross, but in my judgment can be safely netted out. The logic here is simple: the US current account deficit requires than foreigners take a growing net position in US dollar debt. And international banks cannot take large unmatched currency positions – they cannot take in euros and lend in dollars. Or take in RMB and lend in dollars. Their regulators wouldn’t allow it. Any European bank that took a big unhedged position in dollars would be bust by now.
Third, gross foreign private demand for US long-term assets actually hasn't increased over the past few years. What does seem to be growing is gross US private demand for long-term foreign assets. Indeed, US demand for long-term foreign securities and US FDI abroad increased by more that the US current account deficit fell over the last four quarters.
The undercounting of official flows.
My argument here is simple. The monthly TIC data tends to under-state official purchases relative to the annual survey. As a result, the historical official inflows in the balance of payments data tend to be systematically revised up once the survey comes out. The data for q3 2006-q3 2007 has yet to be revised. Specifically, the survey tends to show far higher Chinese and Russian purchases of US debt (and far higher official purchases) than the TIC data. Private banks in London buy US debt (registering in the US data as a private purchase in the UK) and then sell the US debt to the PBoC, the Bank of Russia and some large Chinese state banks. This adjustment should add over $200b to the official inflow total from q3 06 to q2 07.
I state this with some degree of confidence since the increase in Treasuries and Agencies held in the Fed’s custodial accounts exceeded recorded inflows in q4 06, q1 07 and q2 07.
Moreover, even after the survey revisions, the official data understates in some sense official inflows -- and specifically official flows from the Gulf/ other regions that make extensive use of private intermediaries to manage their funds. About 70% of the funds of the Abu Dhabi investment authority are known to be managed externally. As a result, it is reasonable to think that about 70% of any increase in ADIA’s dollar holdings funds would show up in the US data as private inflows. And in some sense they private flows – a private fund manager is managing the money. But the dollar risk is held by ADIA. The private manager’s job is to get the best return on ADIA’s dollar allocation, not to take invest in Europe or otherwise take currency risk. A fair amount of the foreign assets of the Saudi Monetary Agency (SAMA) is also managed externally.
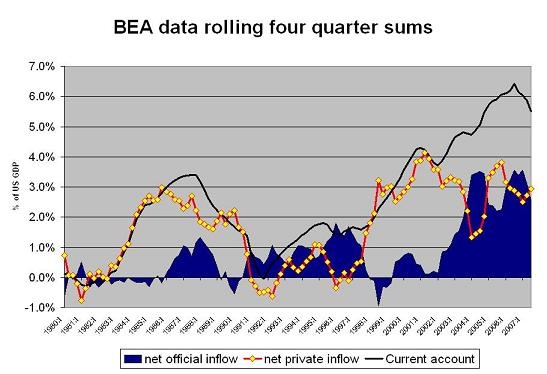
The following chart shows recorded official inflows relative to global reserve growth and my estimate for dollar reserve growth. The global total comes from the COFER data, adjusted for Saudi non-reserve assets and the funds china has shifted to state banks. The dollar estimate hinges on two key assumptions – namely that China and Saudi Arabia (the two key countries that do not report data to the IMF) – have a relatively high dollar share and have not diversified (in the sense of lowering the dollar share) of their reserves significantly over the past several years.
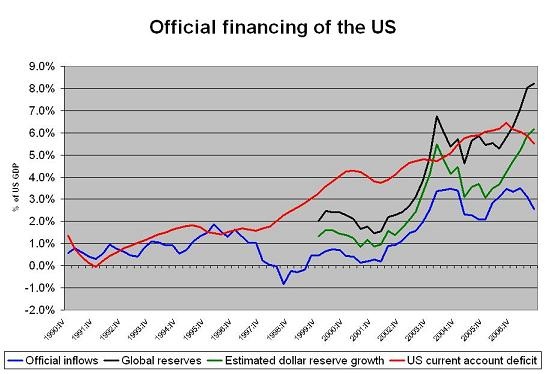
The gap between my estimate and the data through mid-2006 is largely explained by the buildup of central bank dollar deposits in the international banking system (data on dollar deposits can be found on the BIS web site, and in the past I have posted charts that add offshore BIS dollar deposits to the official inflows in the US data). The most likely explanation for the gap after mid-2006 is that the US data has yet to be revised. This spring, the 2006 survey results basically revised the total up toward my estimate, eliminating a large gap between my forecasts and the US data (see my Budget committee testimony, especially the charts at the end). No guarantees, but I would bet something similar will happen when the 2007 survey is released.
The wildcard is increased use of external fund managers by central banks. China's decision to increase the PBoC's swaps with the commercial banks and to force the banks to hold dollars to meet their reserve requirements are but two examples. The more central banks outsource fund management, the less they show up in the US data.
One last note I haven’t included the increase in the money managed by sovereign wealth funds (excluding capital gains) in this chart. Including these funds adds – best that I can tell -- about $100-150b to the overall total (on a rolling four quarter basis) for 2005, 2006 and most of 2007. The CIC will push up the total for the full year if it buys $100b of fx from the PBoC in late December. I assume that the US data on official flows only really captures flows from Norway's funds – in part because the Gulf's sovereign wealth funds are more diversified than central banks and in part because of their use of external managers.
These revisions essentially increase the official flows and reduce private flows – but even in my baseline, the adjustment would only add about 2 to 3% of US GDP to official flows over the last four quarters. Gross private flows would still be bigger than gross official flows.
The rise in gross private inflows comes from short-term flows. Private demand for long-term US assets from foreign investors hasn't increased over the past six years.
The following graph plots gross outflow against gross inflows. However, rather than taking total flows, it breaks down the total into what might be termed bank and bank-like flows (in blue) and long-term flows (in red) – for those who want to check my data, bank and bank like flows come from lines 61. 62, 68 and 69 in the US BEA data (more details about this flows are revealed here as well -- see tables 8a and 9a).
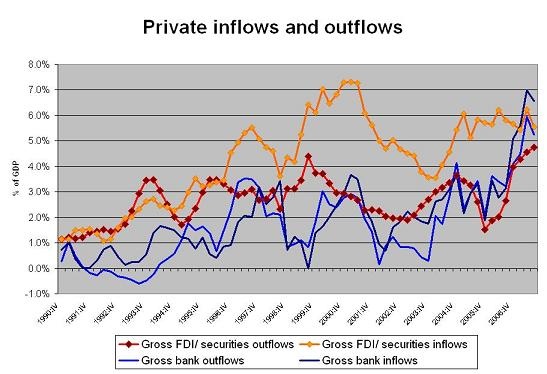
Four things jump out –
First, the recent increase in gross flows (inflows and outflows) has been driven by a rise in cross border bank flows. Other data indicates that this flow is largely in dollars, on both sides. US lending to the world is in dollars, and foreign lending to the US is in dollars. This is not how the US builds up its foreign currency exposure (and generates the capital gains needed to offset its deficits). The lending also seems to be very short-term (US interest income moves with the short-term rate). The borrowing too.
Second, gross bank/ short-term non-bank flows inflows and outflows are highly correlated. When inflows go up, outflows go up. When inflows go down, outflows go down. The tight correlation suggests that these flows are in some sense linked -- big inflow require big outflows. It also confirms that they have not consistently been a major source of net financing for the US deficit. There are of course exceptions -- q3 2007 is one; Richard has noted that q2 2005 is another. But in aggregate, these flows have moved together and thus canceled each other out. That makes sense to me: banks in Europe can only lend to the US if they have dollar funding (or have hedged their currency exposure -) and are not building up a big currency position.
I could have this wrong, but I would argue that including this data in the gross flows paints a somewhat misleading picture. It suggest foreigners are lending a the US a ton of dollars and the US is buying a ton of other currencies. The reality seems more prosaic – US banks lend dollars to offshore banks/ non-bank financial institutions who then lend the dollars back to the US.
Third, the gross private demand for long-term US assets – bonds, factories, equities – doesn’t seem to be rising over time. It is no higher now than in 2000 – and remember the data from 2005 on overstates private demand (by understanding demand from the Gulf) and the data from mid 2006 on really overstates private demand (by understating demand from China, Russia and the Gulf).
Fourth, gross long-term outflows from the US do seem to be increasing over time. The fall in 2005/ early 2006 stems from the impact of the homeland investment act (which dramatically reduced FDI outflows). It reflects a one-off tax break, not a break in the trend.
So where does this leave us?
I personally think that bank and bank-like flows can safely be assumed not to be a major source of financing of the US deficit – and thus a big fraction of the recent rise in gross flows represents a lot of activity with little real result. That is a bit of an over-generalization, but I think it captures an element of truth – namely, that the deficit has largely been financed by the sale of long-term term securities, not be bank flows. The following chart shows these longer-term flows relative to the deficit.
I accept that there is a sense in which netting private inflows and private outflows against each other is deceptive. Official inflows could be said to finance private outflows, not the current account deficit, and private inflows could be said to finance the current account deficit, not private outflows.
Indeed – if the eurozone does not run a current account deficit this year, the roughly $300b in official inflows that it likely attracted in 2007 clearly financed a private outflow. Europe – incidentally – is now far more of a hedge fund (selling safe assets to the world and using the proceeds to purchase risky assets) than the US. The US sells off pieces of itself primarily to fund current consumption, not global investment.
For the US – after adjusting for the under-counting of official inflows – I would argue that the accounting goes something like this:
On the inflow side, the US attracted about $900b of financing from the official sector (counting SWFs and money managed by private fund managers on behalf of official investors) over the last four quarters, and maybe $400b of private long-term inflows (counting FDI).
On the outflow side, the US official sector – the US government – didn’t buy any assets, so the $1300b net inflow financed a roughly $775b current account deficit and $500 plus in private outflows (counting FDI).
Since early 2006, official inflows has increased relative to all sources of long-term financing – and that gross inflow is increasingly financing US capital outflows rather than a US current account deficit.
On top of all this, US banks and non-bank financial institutions lent a lot of dollars to banks in the Caribbean, the UK and other offshore centers and US banks also borrowed a lot of dollars from these places. They did a lot less of this in q3 than in the past.
The net flows data does suggest that the post-2002 expansion of the US current account defiiit is different
Even though it is logically impossible to know if a dollar in official inflows finances the current account deficit rather than private outflows, I still think that looking at net private inflows and net official inflows can be useful. It gives some sense of whether net private demand for US assets is growing or falling.
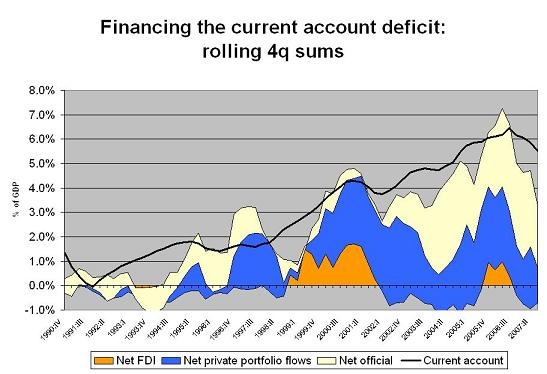
Consider the following graph – which plots net private inflows v net official inflows and the current account deficit.
In the early 80s, the expansion of the US current account deficit coincides with an expansion in net private inflows. High US interest rates made US assets attractive and pulled in private capital. Official flows picked up in the late 1980s, helping to finance a period of adjustment.
In the .com boom of the late 1990s, a surge in private demand for US assets – in this case, US equities – financed another expansion of the US current account deficit.
The most recent expansion of the US deficit looks rather different. It hasn’t been accompanied by a rise in net private demand for US financial assets.
Indeed, net private demand for US financial assets fell quite sharply between 2001 and 2004 without generating a comparable fall in the US external deficit. Compare 01-04 to the late 80s.
In 2005, the combination of the Fed’s rate hikes (Carry!) and the Homeland investment act (Tax breaks!) increased net private demand for US financial assets. But from 2006 on, net private demand for US assets has started to fall.
And my guess is that when the survey data comes out and the BEA data series for late 2006 and much of 2007 is revised, it will show a fall in private demand for US assets that looks as steep as the fall in private demand in 2003 and 2004.
The willingness of official creditors to offset falls in private demand has been a source of market stability – things could have been much worse. But it also has retarded adjustment. That has a cost. It also means that the US government, US households and US firms are increasingly reliant on other governments for financing. That has consequences. The US views itself as a bastion of private enterprise. But the global flow of funds suggests that increasingly the US will be the home of state capitalism – with states in question foreign governments. Right now, private capital wants to finance deficits in the fast-growing, high-yielding emerging world, not the US.
Richard views the deficit as result of investing and borrowing decisions made by “consenting” adults. That is true, so long as those governments now adding to their dollar assets at an unprecedented rate are considered consenting adults. But it seems hard to call the deficits a “market” outcome when the main counterparty to a deficit financed in dollars – in my view – are foreign governments who are accumulating dollar dollar assets at a truly unprecedented rate.
My latest data puts total official asset accumulation, counting sovereign wealth funds, during the four quarters to q3 2007 at something like $1.3 trillion. A large fraction of that went into dollars.
And they are accumulating those dollars not for financial gain, but rather to achieve their policy goals. That may be a stable system -- certainly the key source of stress in the system hasn't come from an unwillingness on the part of central banks to finance the US -- but it isn't what I would consider a market system either.
I am most interested in Richard’s rebuttal – and other reactions.
More on: