 Online Store
Introduction
Over the last several decades, governments have collectively pledged to slow global warming. But despite intensified diplomacy, the world is already facing the consequences of climate…

The income balance — the new driver of the US current accout deficit?
More on:
Many analysts believe – extrapolating from the q4 data and the stabilization of the non-oil trade deficit – that the US current account deficit has peaked. Stephen Jen is the most prominent example, but far from the only one. Reuters reported a while back:
"We believe the current account has peaked" and will decline to $809 billion in 2007, said Nigel Gault, U.S. economist for Global Insight. "The trends are becoming more favorable. Robust export growth, and some cooling in import growth, should keep the deficit down this year."
I disagree -- at least if the US avoids a housing-induced recession and US growth re-accelerates over the second half of the year.
Why? Like Dr. Chinn, I expect the income balance will deteriorate significantly in 2007. The US looks set to grow more slowly than the rest of the world, but I doubt that will generate a improvement in the trade balance sufficient to offset the deterioration in the income balance. The deterioration in the income balance has taken longer to materialize than Dr. Roubini and I anticipated back in 2004, but I am fairly confident the deterioration will emerge in 2007.
The US trade deficit – the non-oil trade deficit at least – did stabilize in 2006. World growth was strong, pushing up US exports. The lagged effect of the dollar’s 2003 and 2004 depreciation also helped – in most econometric models there is a 2-3 year lag before the full impact of a currency move is found in the export data.
US non-oil import growth slowed along with the US economy. I was a bit skeptical on this front – largely I wasn’t seeing a slowdown in the trade data with East Asia. But it turns out I wasn’t looking in the right place. US imports from Canada (non-energy imports) fell quite sharply. Think autos. Think timber. The category “non-oil industrial supplies” includes a lot of things that go into building houses.
If Nouriel Roubini's recession call is right, the US trade deficit could well fall, not just stabilize, in 2007. Nouriel though is a real grizzly, not just a bear. He doesn't believe the world will be able to decouple from the US. A global slump would cut into US exports as well as US imports, though the fall in exports would come with a bit of a lag. The US trade deficit should still fall in a true “grizzly” scenario, at least so long as "geopolitics" don't get in the way: a global slump should lower the US commodity import bill.
If the US avoids a recession and just experiences a period of below par growth I would expect non-oil import growth to pick up a bit. Non-oil import growth was only 2% on a y/y basis in January, that is a bit low for a consumer-driven economy. And I also expect US export growth to slow a bit over the course of 2007. World growth is unlikely to be much stronger than it was in 2006. Boeing simply cannot export any more planes until the 787 line opens (and US airlines may start buying too). The lagged impact of the dollar's 2003-04 fall will start to wear off, and the absence of more investment in US export capacity may start to bite.
A modest pickup in non-oil import growth and a modest slowdown in export growth would– if oil stays around its 2006 price – keep the trade deficit roughly constant in nominal terms. If strong global growth and a weak -- at least v. the euro -- dollar combine to keep export growth up, the deficit could well fall.
But that only translates into an improvement in the current account deficit if the income balance doesn't deteriorate. Let me see if I can persuade you why that long forecast deterioration in the income balance may actually materialize in 2007 – using a lot of charts.
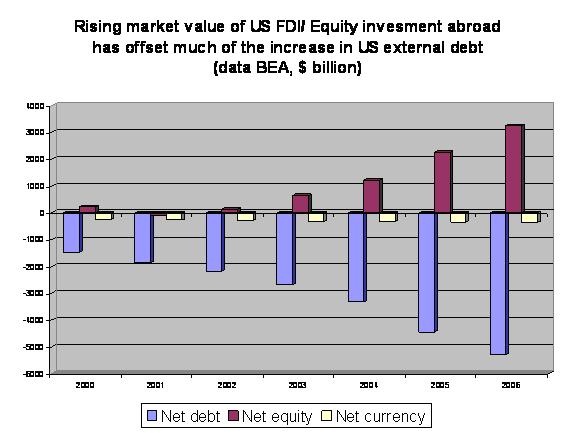
Let’s start by looking at the evolution of the US net international investment position. I like to break the net international investment position broken into a net debt position and a net equity position. The net equity position is the difference between US external equity investment and foreign equity investment, the net debt position is the difference between the United States borrowing from the rest of the world and the United States lending from the rest of the world. Gross US external debt, for example, is close to $9.9 trillion, but it is offset by about $4.6 trillion in US external lending. The gap is the net debt position.
I estimated the 2006 NIIP using market moves and the available flow data. In broad terms, the rising value of US equity investment abroad (form a mix of dollar depreciation and the out-performance of foreign equities) improved the US net equity position, offsetting the ongoing rise in US external debt associated with ongoing current account deficits.
The income balance, in turn, can be thought of as the sum of the difference between what the US earns on its equity investment abroad net of what it pays on equity investment in the US and the difference between what the US pays on its external debt and what it gets on its external lending.
Theoretically I should look at dividend payments on portfolio equity investment, but those are small – so in practice, I tend to look at the gap between the returns on FDI and the gap between the US lending and the US borrowing rate.
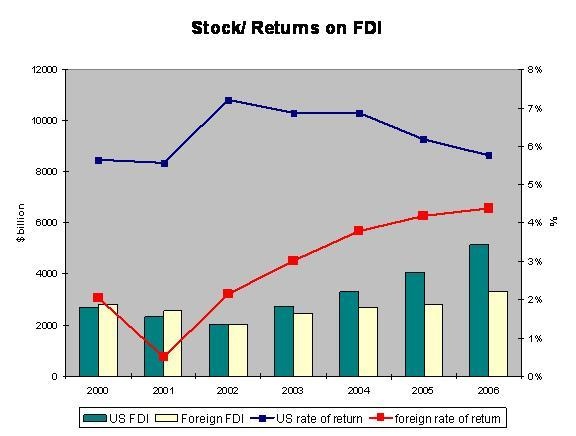
First, FDI.
The next chart shows the stock of US FDI abroad, the stock of foreign direct investment in the US and the implied return on each. The implied return on US FDI abroad has been trending down – largely because of the big rise in the market value of US investment abroad has depressed the implied yield on that investment. The implied return on foreign FDI in the US has been rising. But it remains quite low on an absolute scale.
The US data can be disaggregated further – as the overall return on FDI in the sum of dividends and interest payments on inter-company loans and reinvested earnings (which are double entered in the balance of payments – current income from US FDI in effect is used to finance an increase in the United States foreign assets). The gap in returns comes entirely from the difference in reinvested earnings. Actual cash returns are similar (and low). The big fall in reinvested earnings in 2005 stems entirely from the Homeland Investment Act.
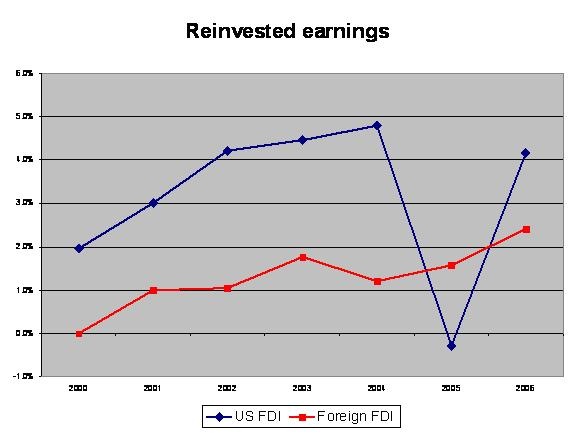
Looking ahead, so long as the US avoids a severe recession, there is little reason to think the basic trend will change – the US should continue to receive more on its FDI than it pays. Some of that gap likely reflects an undercounting of foreign earnings in the US, but there isn’t good reason to think that undercounting will change.
Next debt.
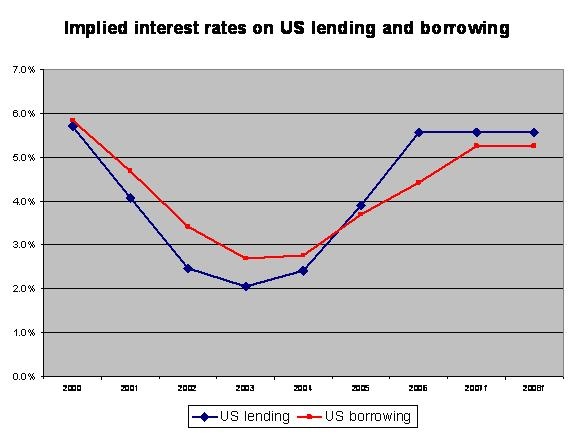
As the following chart shows, the implied interest rate on both US lending and borrowing rose sharply in 2006 – the implied interest rate on US debt rose from 3.7% to 4.4% while the implied interest rate on US lending rose from 3.9% to 5.55%. However, the implied rate on US lending rose faster than the implied rate on US borrowing – the gap between those two rates increased from 0.2% to 1.2%.
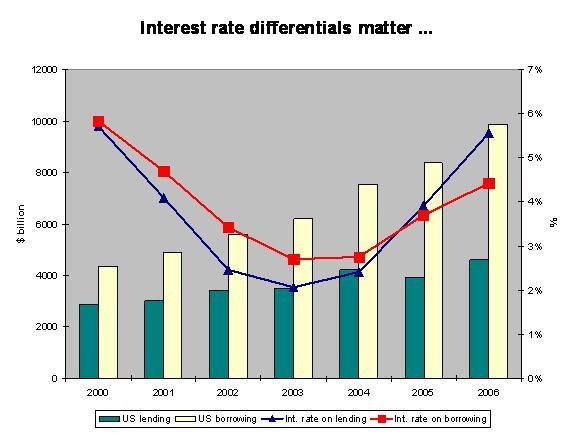
That had a big impact on the balance of payments. About $4.6b of US lending is in effect financed by US borrowing from the rest of the world, and the US earned about $50b by borrowing (on average) from the rest of the world at lower rate than it lends to the rest of the world.
Is this gap likely to be sustained – creating what Hausmann and Sturzenegger would call dark matter? I don’t think so. When short-term US rates fell in 2002 and 2002, the lending rate fell faster than the borrowing rate. And when US rates rose, the lending rate rose faster than the borrowing rate. I don’t think the US is borrowing cheaply to lend at high rates so much as borrowing on average at longer maturities than it lends on average. The current shape of the yield curve is very favorable to the US.
In 2007, I expect the average interest rate on US borrowing to continue to rise. If it rises at the same rate as in 2006, it would reach 5.2%. Suppose the US lending rate stabilizes at 5.55%.
What then happens?
Well, the US earns less on its financial intermediation – and ends up paying more on its debt position. The overall deterioration in the US income balance from this simple exercise is close to $150b in my projections.
Will that prove right? Probably not. It probably overstates the likely rise in the average interest rate on US borrowing. But even if the rise in US rates is spread over a couple of years, the deterioration in the income balance in store as the average interest rate on US borrowing catches up with the average rate on US lending (most US borrowing AND US lending is in dollars; US holdings of Brazilian real and Turkish lira debt are a drop in the bucket relative to the $4.6 trillion stock of US lending) is substantial.
The basic math – in very ball park terms – is actually quite simple. The US now has roughly $10 trillion in gross debt, and $5 trillion in gross lending. The debt has a current average interest rate of 4.5%, the lending a current average rate of around 5.5%. That works out to around $175b in net interest payments.
Net debt is also growing by about $1 trillion a year, so by the end of 2008, the US should have roughly $12 trillion in debt, and $5 trillion in lending (assuming the US doesn’t borrow more to lend more). If the average rate on that debt rises to 5.25% and the average rate on US lending stays around 5.5%, the US would be paying around $355b in interest payments …
That works out to a deterioration in the net interest balance of around $180b. I don’t think that is analysis by assertion – it is analysis by assumption. If my core assumptions – namely that US gross and net external debt will continue to rise, and that the average rate on this debt will rise – are off, the results will be off.
You might challenge the assumption that average US interest rates will rise by noting that the ten-year treasury rate is currently closer to 4.5% than 5%. I would respond by noting that so long as the fiscal deficit is where it is, the US cannot raise $1 trillion abroad by selling ten year treasuries at 4.5%. It also sells a lot of things that have a bit of a spread over Treasuries.
You might argue that the Fed will cut rates so the average rate on US borrowing won’t rise. My retort is simple: falling short-term rates will cut into US earnings from its lending as well. The average rate on both lending and borrowing will be lower than in my baseline. But so long as the gap shrinks the basic dynamics are the same.
The timing of that deterioration in the income balance is uncertain – I haven’t yet figured out how to infer the precise term structure of US lending and borrowing from the implied interest rate. Rising net interest payments could also be offset by growing net profits on US FDI. But I still have a hard time seeing how the US manages to avoid making big net interest payments – and running a substantial income deficit – over the next few years. The gap between the US borrowing and US lending rate that emerged in 2006 is unlikely to be sustained.
More on: