China's Current Account Surplus Is Likely Much Bigger Than Reported
China’s financial account is interesting, and not well understood.
China’s state didn’t stop accumulating foreign assets when it stopped adding to its reserves – though with dollar rates now above Chinese rates, China is now drawing on, rather than adding to, its shadow reserves.
More on:
But China’s current account also isn’t quite what it seems.
The current account is the sum of the goods balance (a big surplus for China), the services balance (a modest deficit now thanks to renewed tourism flows), and the balance on investment and labor income (technically now in deficit thanks to a reported deficit in investment income).
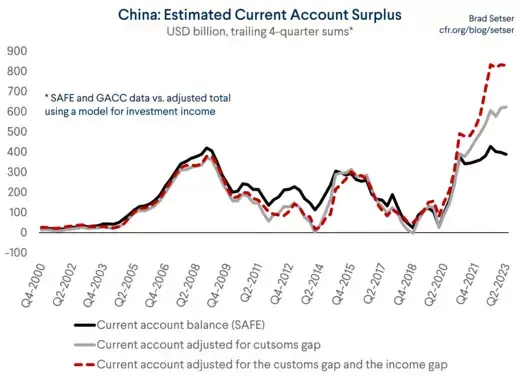
Both the goods surplus, which is much smaller in the balance of payments than in the customs data, and balance on investment income, which remains in deficit even with the rise in U.S. interest rates, are suspicious. With reasonable adjustments, China's “true” current account surplus might be $300 billion larger than China officially reports. That's real money, even for China.
First the goods balance.
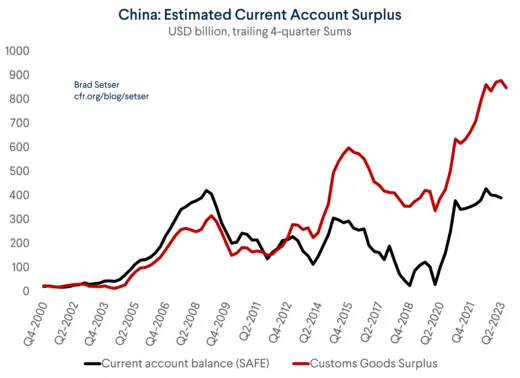
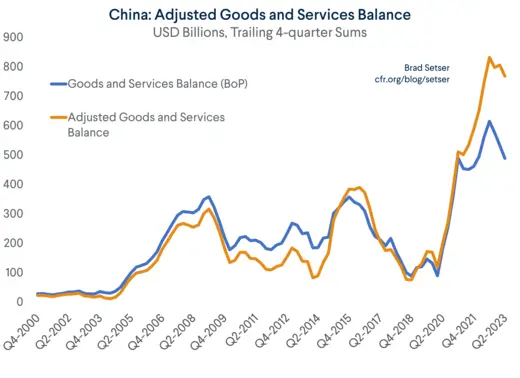
China’s goods trade surplus has more than doubled since the pandemic, going from $400 billion a year to $900 billion. All else equal, the current account surplus should have increased in tandem.
More on:
Moreover, the rise in the customs surplus data makes economic sense: China's trading partners provided a lot of support to their consumers to keep household income up during the pandemic, while China did not. China's GDP data shows that China has generated at least (three!) percentage points of growth from net exports since the end of 2019. That is a lot; net exports typically aren't a big source of growth for large economies (imports and export rise in parallel most of the time). But the rise in net exports in the GDP data and the rise in the customs trade surplus just doesn't show in the current account data.
Alex Etra of Exante data has shown that the mirror image data from China’s trade partners tells practically the same story. China is running a much bigger surplus with Europe, for example. China’s deficit with its chip supplying neighbors is also down. There also hasn’t been much change in China’s reported surplus with the U.S., even with the Trump tariffs, in the Chinese customs data.*
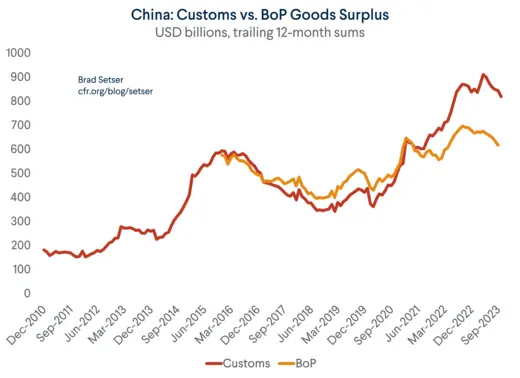
So, the customs surplus does really seem to be just under $850 billion.
That surplus mysteriously falls to just under $620 billion in the balance of payments data.
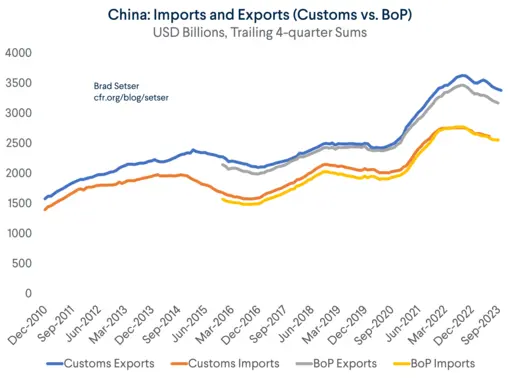
There are some small technical differences between the customs data and the balance of payments data. For example, the balance of payments data for imports should be a bit smaller than in the customs data, as the cost of insurance and freight is moved over to the services account (for a long time this was just a 5 percent shift from goods to services).
However, that adjustment actually raises the goods surplus in the balance of payments data. It thus doesn't explain why the balance of payments surplus in goods is smaller than the customs surplus in goods.
Similarly, merchanting (a Chinese firm buying a U.S. good and selling it in Europe without moving it through China’s customs border), should raise China’s surplus in the balance of payments data. Chinese oil companies bought the rights to U.S. liquefied natural gas (LNG) a long time ago, and often have sold the actual LNG directly to Europe or elsewhere in Asia rather than shipping it to China.
Historically, the two series have lined up well. They only started to diverge in 2021.
China has argued that exports from foreign companies operating in bonded zones (geographically in China but technically outside of China’s legal border for tariffs and tax) should not be counted as Chinese exports (Apple’s main manufacturing subcontractor operates in one such bonded zone, and so on). But in that case, imports into bonded zones also shouldn’t appear in the balance of payments data, and Chinese parts sold into the bonded zone should count as exports.
It gets a bit complicated, but China's explanation (here) doesn't really make sense.
The obvious point here is that the gap between the customs numbers and the numbers in the balance of payments only emerged recently, and nothing about the operations of foreign firms in the bonded zones obviously changed in 2020 or 2021 to account for a sudden change.
The best possible explanation is from Adam Wolf. He adjusted for Chinese exports from free trade zones (one form of bonded zones in China's terminology) and argued that a surge in exports from free trade zones may account for the increased discrepancy in 2021.
I am not convinced. If exports from free trade zones are taken out because the bonded zones are legally outside China, there should be an offsetting fall in imported parts. But imports are up in the balance of payments data not down. Now goods produced in the bonded zones and then sold into China would technically be imports (China would be importing from itself in some sense, but not in a legal sense because the bonded zones are legally offshore). So the argument needs to be that there are offsetting adjustments to "onshore" imports, and a certain share of customs exports are technically produced by foreign firms in areas of China that are legally offshore and thus don't enter in the balance of payments. China as Ireland so to speak.
But it is still hard to understand how this generates a big adjustment to the overall current account.
If the trade accounts are being fully adjusted to take free trade zones out of the data, there should be some offsetting changes elsewhere. For example, all the wages paid to Chinese workers in the special customs zone should be considered exports of labor services to foreign multinationals operating offshore, which would register as an increase in the labor income of Chinese residents in the income balance (Chinese factory workers who work in the bonded zones technically would be earning income outside of China per the accounting). The net effect of all the offsetting adjustments on China's overall balance should be zero – and it clearly has not been.
The sums involved are big, and the data just doesn't quite add up. China has not provided a convincing explanation for why the gap emerged recently, nor a detailed account of the precise adjustments it now makes for the bonded zones. If the gap between the reduced goods surplus in the balance of payments and the underlying customs data is removed from the reported numbers, China's goods and services surplus would be way up.
Now the investment income balance.
Investment income is the income China receives on its investment in foreign bonds, the interest it gets on its foreign lending, and the dividends paid back to China by the offshore operations of Chinese firms net of the interest China pays on its external debt and the dividends foreign firms operating in China pay back to their parents.
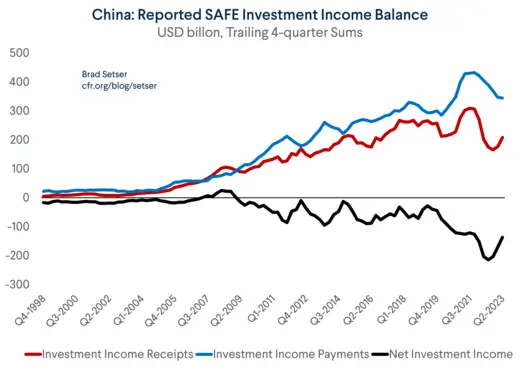
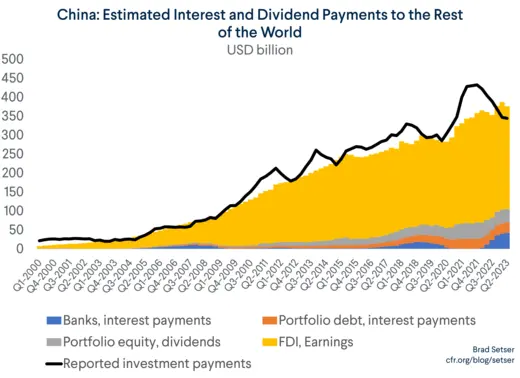
China's investment income deficit increased significantly during the pandemic – and that deficit has remained even as dollar interest rates appear to have moved in China's favor. China, remember, holds a lot of dollar bonds, and its state banks have lent out a ton of dollars.
China doesn’t provide any underlying detail here in the balance of payments data, which is a problem in itself. Obviously China is trying to make it hard to estimate the interest income on its reserves, but that practice has persisted even though income on China's formal reserves no longer dominates the data. And China is too big (and too important globally) to get a free pass on basic economic data for much longer.
Let’s go through the math to illustrate why the persistence of the income deficit is a bit of a puzzle. Matt Klein agrees, by the way.
Start with the basics. China has over $3 trillion in foreign exchange currency reserves. $3.25 trillion, in fact, if the state banks’ required reserves held at the State Administration of Foreign Exchange (SAFE) are counted. The total would be a bit higher if gold and China's IMF position were added in.
The state commercial banks have roughly another $1 trillion in net foreign assets (a mix of loans, offshore deposits, and investments in foreign bonds).
The state policy banks hold another $1 trillion or so in loans. This, sadly, isn’t transparently disclosed, but it is implied by the net $2.5 trillion in Chinese bank assets abroad that China reports to the Bureau of Industry and Security (BIS) – and it is also a sum consistent with Aid Data's detailed (and very impressive) forensic work.
So, to simplify, let’s just take the BIS number for the banks foreign assets (around $2.5 trillion). Adding that sum to reported reserves and the funds the banks hold at the PBOC leads to an estimate that China has around $5.75 trillion gross foreign reserves and interest-paying assets.
China has borrowed about $1.5 trillion dollars from the world. And it also pays interest to foreign investors on about $700 billion of foreign holdings of Chinese yuan bonds.
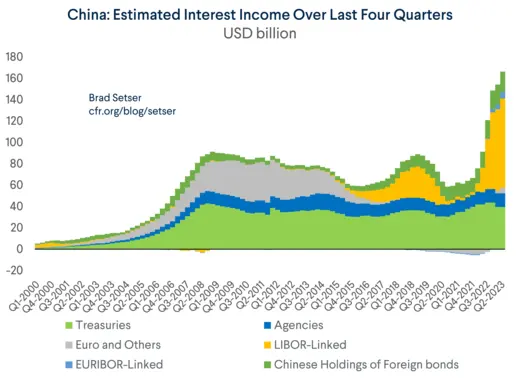
China therefore has, on net, a little over $4 trillion in foreign currency assets abroad. It should be making over 3 percent on those assets. Possibly close to 4 percent (China has been buying high-yielding Agencies, and the policy banks often lent at LIBOR + 300).
The ballpark math: 3 percent works out to over $120 billion in interest income a year; 4 percent comes in at $160 billion. Net out the $20 billion or so China pays every year on foreign holdings of yuan bonds ($700 times 3 percent) and China should have a surplus in interest income of $100 billion to $140 billion.
China, of course, could still run a deficit on investment income if it pays a ton more on foreign direct investment inside China than it earns on its (more limited) direct investment abroad.
The obvious test though isn't possible as China only reports data the total investment income payments and receipts. There simply is no separate line item for dividends, so interest income cannot be directly inferred from China's reported numbers.
The data that China reports does show an overall deficit in investment income in the last 4 quarters of data of around $200 billion.
So, given the reported total deficit and the estimated surplus in interest income, the overall numbers work only if there if foreign investors in companies in China generate about $300 billion more in income than Chinese companies generate on their investment abroad.
Let's dig a bit deeper: China reports that Foreign direct investment in China is about $3.4 trillion and Chinese direct investment abroad is about $2.8 trillion. That isn't a huge gap. The large net outflow of investment income would only happen if foreign investment in China is wildly more profitable than Chinese investment abroad.
Is that kind really plausible when China’s economy has slowed and the property sector is in the doldrums?
To be sure, there is a roughly $1 trillion gap between reported portfolio equity investment in China and Chinese portfolio equity investment abroad. But dividend income on most stocks tends to be modest, so that alone isn't likely to generate a $300 billion deficit on equity investment income dividends.
The numbers here don't seem to work. The gap in dividends paid on equity investment just seems too big.
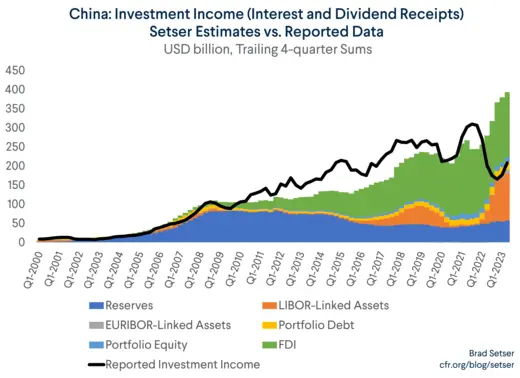
But what is really hard to explain is that the reported offshore investment income, including interest income, has tumbled since the end of 2021.
That makes no sense.
Remember that most of China’s offshore assets are in dollars, and a large share are now linked to short-term interest rates. Dollar rates are obviously up over this period.
To help calculate what China's investment income should be, it helps to construct a simple model. The model itself isn't fancy, but I think it breaks a bit of new ground. It at least provides a baseline for assessing China's reported data.
China's interest income on its reserves can be estimated using the latest reported data on the dollar share of its reserves, with the assumption that China's interest payments on its Treasury (and Agency) holdings map to the average paid to all foreign investors.
Let’s assume China receives the interbank dollar rate (LIBOR) on most its external lending. I assumed that 90 percent of China's external loans are in dollars and only 10 percent are in euros, consistent with the Aid data analysis. Obviously some Chinese loans are on more concessional terms, but some are also at a substantial premium to LIBOR. Using LIBOR is thus just a best guess to offset the lack of reported data.
I also assumed, based on a back fit with reported data. that foreign direct investors are getting a return of 8 percent on their investments in China.
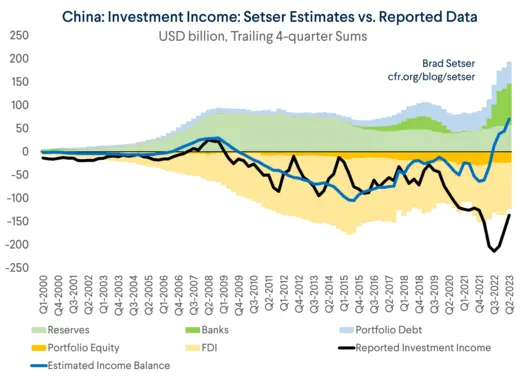
The model more or less works up until about 2021. If anything, it underestimates China's investment income over time.
It gets foreign income on foreign investment in China more or less right (by construction, as I raised the estimated FDI yield to get a match).
Factoring in all of this, China’s interest receipts should now be about $200 billion higher – per the model – than China now officially reports.
The model implies China's overall income balance should now be back in a surplus of around $70 billion thanks to the rise in U.S. short-term interest rates.
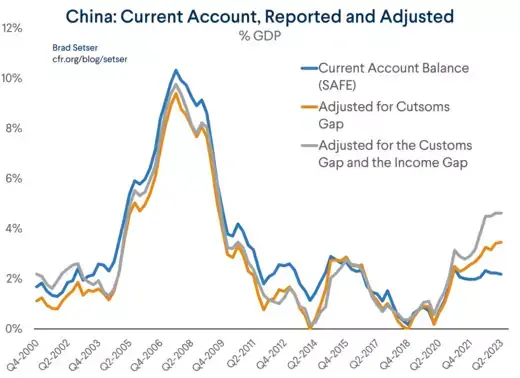
So without the unexplained deficit in investment income and the discrepancy between customs goods and balance of payments goods, and China’s current account surplus would now be around $800 billion, over 4 percent of its GDP.
There are enough questions about the true size that I think the IMF should make this a priority in its surveillance.
The last few IMF Article IV reports have focused on China’s fiscal position. The balance of payments hasn’t been an area of concern, or even a real focus.
The IMF's recent staff paper on China’s government balance sheet shows that the IMF is capable of truly exceptional work.
A comparable analysis of how China’s external balance sheet relates to the current account would be enormously valuable. China’s state has a lot of external assets that are not held by SAFE, and no one (to my knowledge) has definitively mapped all of the external assets and liabilities of China’s government, or estimated the returns that they now provide.
That brings me to my final point.
Why would SAFE want to adjust its methodology for counting the goods surplus, and why would it want to muck up the investment income data?
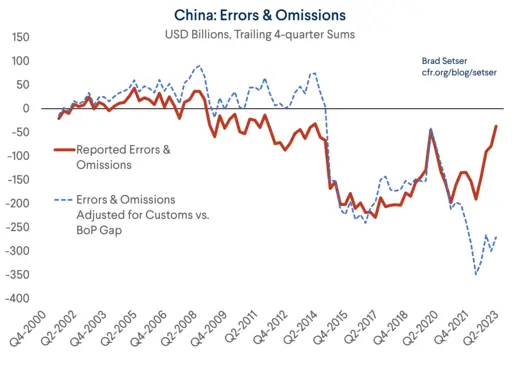
One reason: a lower current account surplus mechanically reduces reported errors and omissions in the data. Errors aren’t directly measured; they are the gap between the calculated current account surplus and the recorded increase in the foreign assets of Chinese residents measured. A lower surplus means lower errors, and thus implies less “hot” outflows.
A second reason of course is that a higher current account surplus would lead to more scrutiny from the IMF (the IMF estimates China's current account norm is about a percent of GDP, and allows for a percentage point of GDP error bound, so a 2 percent of GDP surplus doesn't imply any structural undervaluation of the yuan) and from the U.S. Treasury (which has set 3 percent of GDP as its threshold for triggering enhanced scrutiny for currency manipulation).
Bottom line.
I suspect an accurate measure of China's current account surplus would show two things:
- China’s current account surplus is 1.5 and 2 percent of GDP higher than reported, and has moved up in line with the increase in China reported customs goods surplus.
- Errors (disguised capital outflows by Chinese residents) have also remained around 2 percent of China’s GDP rather than collapsing.
Time to try to find out for real.
* The U.S. data shows a smaller deficit than the Chinese data shows a surplus these days, a reversal of the past pattern. The reversal is clearly tied to the tariffs, and the most likely explanation is tariff avoidance (see Anna Wong). Chinese exporters have every incentive to report exports to China customs (to claim the VAT rebate) and most have an incentive to avoid registering in U.S. customs and paying now significant tariffs. Plus, the U.S., as a matter of policy (the de minimis exception), doesn’t collect tariffs on firms like Shein that ship directly to the consumer from China. A U.S. firm can also set up a warehouse in Mexico and ship to American consumers tariff free. Basically, it is easy to show a fall in the bilateral trade deficit if you don’t count a big chunk of imports.
 Online Store
