 Online Store
International efforts, such as the Paris Agreement, aim to reduce greenhouse gas emissions. But experts say countries aren’t doing enough to limit dangerous global warming.
More Evidence That LIBOR Is Manipulated, and What It Means
More on:
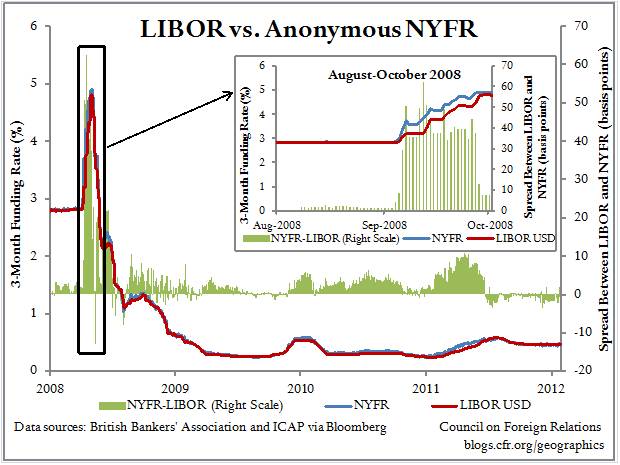
Barclays’ admission that it deliberately understated the interest rates at which it could borrow between September 2007 and May 2009 suggests grievous flaws in the widespread process of using LIBOR (the London Inter-Bank Offered Rate) as a benchmark off which to price commercial loans, mortgages, and other forms of lending. Our figure above illustrates this by comparing LIBOR with so-called NYFR (ICAP’s New York Funding Rate), the operative difference between the two being that NYFR is based on anonymous reports from major banks. Normally LIBOR and NYFR are closely aligned, yet a huge gap opened up between the two rates in September 2008, at the time of the Lehman Brothers and AIG crises. During that month in particular, a bank revealing publicly that it could only borrow at elevated rates naturally put itself at risk of suffering a bank run or lending halt. It should not be at all surprising, therefore, that banks would be less honest about their rate reports when their names were attached to them. A Golden Rule of market practice and regulation should surely be never to trust prices – and certainly never to encourage actual transactions using such prices – when they are formulated not by supply and demand in competitive markets but according to what self-interested parties would like others to believe them to be.
Financial News: Questioning LIBOR
MacKenzie: What's in a Number?
Reuters: ICAP to Launch U.S. Rate Alternative to LIBOR
More on: