 Online Store
International efforts, such as the Paris Agreement, aim to reduce greenhouse gas emissions. But experts say countries aren’t doing enough to limit dangerous global warming.

More oil, less stuff: The US January trade data
More on:
The Fed’s dramatic policy announcement has justifiably overshadowed the January trade data, which didn’t tell us much that we didn’t already know. Suffice to say that the rise in the overall deficit reflects a rise in the US imported oil bill.
Seasonally adjusted oil imports were $39.5b in January, up from $24.84b last January. The average price of imported oil was $84.09. If the net oil import bill (seasonally adjusted) averages $35b a month -- its January level -- the net petroleum balance would deteriorate by $125-30b. That though may be a bit too optimistic given recent moves in the oil market. Any way you cut it, oil will be a big drag -- and likely keep the overall trade deficit up.
Non-oil imports though are falling, in both nominal and real terms. January non-petroleum goods imports were around $133b, down from $136-137b in q3, and $138b as recently as November. Real imports are also falling.
Nominal exports are still rising, but real exports seem to have mostly stalled. The following graph -- prepared with help from Arpana Pandey -- shows real goods exports and real goods imports (from the BEA data) since 2004.
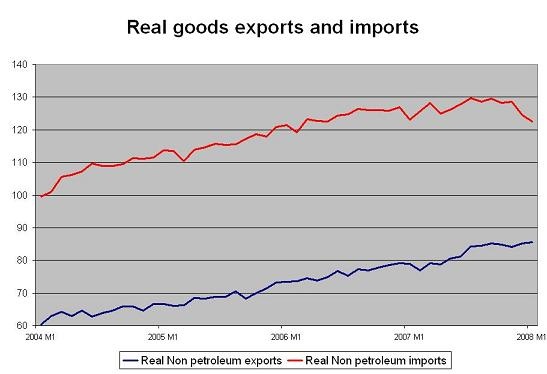
The rise in dollar terms reflects higher agricultural prices and the like. Ag exports are up 43% in nominal terms -- paced by a doubling of soybean exports and big increases in corn and wheat exports.
The bilateral data for China is also interesting. Overall non-oil imports (seasonally adjusted) are up 2.5% y/y -- but consumer good imports are essentially flat.
Perhaps not surprisingly, US imports from China (non-seasonally adjusted) are also flat. January imports were only up 2.1% y/y. That is below December’s 6.5% -- and well below the overall rate of growth in China’s exports. US imports from China continue to grow just a bit faster than US imports from the rest of Asia -- which were up 0.5% y/y in January -- but the gap is shrinking.
US exports to China by contrast continue to grow. And -- surprise of all surprise -- the bilateral deficit with China is now coming down. The January 2008 deficit ($20.3b) was smaller than the January 2007 deficit ($21.3b). The overall deficit with the Pacific Rim is also falling ($29.65b in 08 v $31.6b in 09).
Interestingly enough, US imports from Europe are now growing at a faster pace (4.7%) than US imports from China. A J curve effect? Or imports of refined petroleum from Europe? The overall US deficit with Europe is falling, but not quite as fast as it was a while back.
The US slowdown in the main reason why the US deficit with China is now falling. And the divergence between China’s shrinking surplus with the US and its rising surplus with Europe no doubt reflects the fact that Europe is growing faster than the US. But I also suspect that the fact that the RMB is now rising in a significant way against the dollar while still sliding against the euro may have something to do with the difference.
Then again I have long thought that exchange rate changes matter, unlike some.
More on: