 Online Store
Introduction
Over the last several decades, governments have collectively pledged to slow global warming. But despite intensified diplomacy, the world is already facing the consequences of climate…
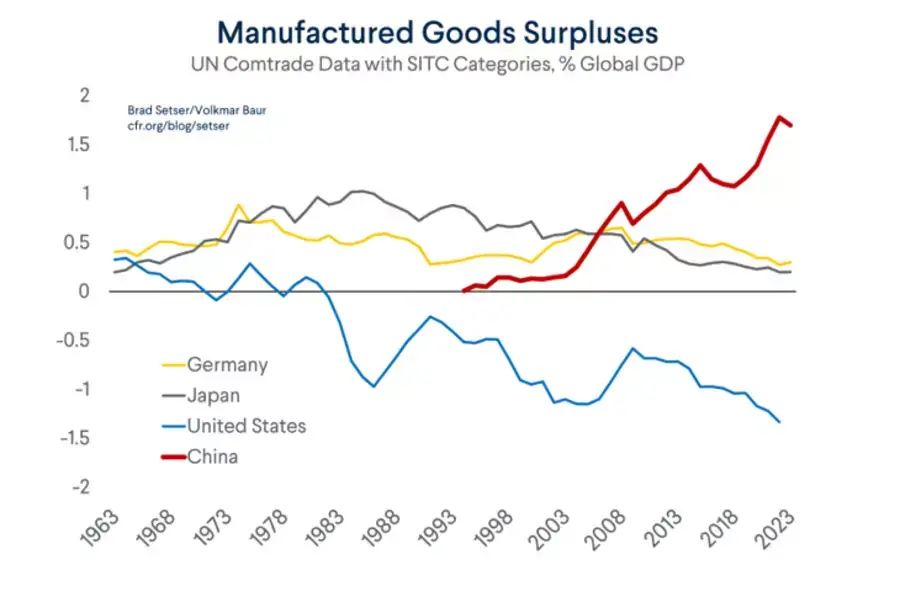
China’s Record Manufacturing Surplus
The U.S. likes talking about the dominance of the dollar. But don’t short-change China’s current dominance of manufacturing trade. Trade imbalances need to be taken seriously again.
This is a joint post by Michael Weilandt, Volkmar Baur of Union Investment, and Brad Setser.
China has emerged over the last two decades as the “world’s factory floor.”
More on:
But some still understate China’s dominance of global manufacturing trade – and are misled by the current discourse about “fragmentation.” Shifts in China’s bilateral trade data with the U.S. are sometimes considered evidence that China’s centrality to global manufacturing supply has fallen.
In fact, China’s post-pandemic surplus in manufacturing – which has now reached about two percent of world GDP – far exceeds the peak surpluses run by export powerhouses like Japan and Germany. More importantly, China’s surplus shows no signs of shrinking. While there was a pause in the expansion of the surplus in 2023, that only came after a huge jump between 2018 and 2022. And now, Chinese policy continues to emphasize upgrading China’s capacity in advanced manufacturing as a major driver of future growth.

It should go without saying that a large manufacturing surplus requires an offsetting deficit in manufactures elsewhere in the global economy.
That deficit could just be with commodity exporters – there is a natural trade between oil exporters like Russia and the Gulf and manufacturing exporters like Europe and East Asia. But right now, the main counterpart to the Chinese surplus is not in the commodity exporters but in the United States. The U.S. deficit has continued to increase in the past few years as a share of world GDP, in part because global dollar GDP has shrunk with the dollar’s rise.
The data here is based on the Standard International Trade Classification (SITC) system, and it uses the “standard” breakout of manufactures, using categories 5 through 9. Special thanks to Volkmar Baur of Union Investment for digging up the long time series in the UN Comtrade data set.
More on:
Don’t be fooled by China’s modest reported current account surplus, which misleads – China’s underlying surplus in manufactures (and indeed in all goods) remains exceptionally large. Absolutely, and relative peak combined surplus of Germany and Japan back in the 1970s and 1980s.

While China’s manufacturing surplus was more or less flat in 2023 (at around 1.7 percent of global GDP) in the face of a post-pandemic retrenchment in consumer demand for goods, China continues to show underlying signs of ongoing export strength in a number of key sectors. For example, China’s exports of autos – both EVs and internal combustion engines – have soared. BYD out-produced Tesla in Q4 2023 and is now looking to secure its long-term profitability by increasing its exports.
But for all the attention given to China’s surging EV exports, around two-thirds of the 5 million cars that China exports annually are powered by gasoline or diesel.
China’s dominance in clean technology manufacturing is far broader: it manufactures 80 percent of the world’s solar panels, a higher share of solar wafers, and most of the capital goods needed to make solar panels. It not only produces more wind turbines than anyone, but its wind turbine components are increasingly used by other turbine producers. And, of course, China now at least aspires to export aircraft as well as trains, ships, autos and of course electronics.
The recalibration of U.S. bilateral trade following the Trump tariffs (lists 1, 2, 3, and 4a collectively raised bilateral tariffs by about 15 percent according to Chad Brown) has drawn attention to the role that Mexico and Vietnam now play as suppliers of final goods to the U.S. market. But make no mistake, Mexico and Vietnam are still manufacturing minnows compared to China. No wonder U.S. firms often struggle to find alternatives to Chinese supply.

The data here lags a bit and misses the surge in China’s manufacturing exports between 2020 and 2022. But a quick look at manufacturing export market share shows that China’s large surplus reflects an impressively broad export base. Note the shift in relative position of China and the United States from 2000 to 2010 – and the additional swing that happened over the course of the pandemic.
Europe has collectively done a better job retaining its centrality to global manufacturing supply.*

China’s broad dominance of manufacturing is also apparent – as Richard Baldwin and others have noted – in a chart of total manufacturing output. Its 35 percent share far exceeds its share of global output (just over 15 percent). Michael Pettis is right to emphasize that China is a production giant and a consumption pygmy.**
What’s more, all of this was before a considerable tick up in Chinese exports in 2021 and 2022 that isn’t in the comprehensive OECD data yet.
China’s manufacturing dominance shows up everywhere except in its reported current account surplus (which is only 1.5 percent of China’s GDP) and, well, in the IMF’s analysis of China. The IMF has focused on the risk of fragmentation, as well as those posed by China’s local government debt – but not on China’s contribution to global trade imbalances. The latest rise in manufacturing imbalance hasn’t entered the IMF’s assessment.

That is a bit of a problem. It is true that China’s specialization in manufacturing reflects its large population and limited natural resources supplies other than coal. But the world-beating manufacturing surplus – and a sizeable goods surplus – highlight that China’s surplus also reflects underlying policy imbalances, including deep-seated resistance to standard consumer-based stimulus programs and a limited social safety net that have supported a massive savings surplus, as much as Ricardian comparative advantage.
And, alas, the latest set of IMF’s policy advice to China highlights the difficulties that come from failing to recognize that trade imbalances are once again a problem.
The IMF thinks China’s equilibrium level of housing investment is about half of what it has been in the past. Fair enough.
It believes that China needs a rather enormous (7.5 percentage points of GDP) fiscal consolidation to stabilize off-budget debt levels.
And it wants China to rely on a more price-based monetary policy (code for cutting rates) and increase its exchange rate flexibility (code for letting the yuan depreciate).
Standard econometric estimates (derived from work done at the IMF) would suggest these policies, if adopted, would raise China’s current account by 4 percentage points of China’s GDP, or close to a percentage point of world GDP. Given China’s comparative advantages, such an adjustment would mean yet another rise in China’s surplus in manufactures. Excess capacity would turn into excessive reliance on exports to make up for shortfalls in internal demand.
That’s the problem with an analytical approach that doesn’t focus on balance of payments – the proposed solution to China’s internal imbalances is to make an already large trade imbalance much bigger.
We argue that the size of the current trade imbalance (correctly measured) should be more than a source of astonishment – it also needs to be factored into Chinese policymaking, and external policy advice.
That would be a big shift in the current consensus in institutions like the IMF, as the standard view right now is that the fall in China’s current account surplus after the global financial crisis means that external imbalances aren’t really a pressing issue.
But if China achieves its goal of growing on the back of an expanding surplus in advanced manufacturing while cutting foreign suppliers out of key parts of its domestic market, its trade partners understandably have a somewhat different view.
* The U.S. of course has done very well in shifting valuable intellectual property to low tax jurisdictions; those intangible earnings support very high stock market valuations – but the big U.S. digital platform companies aren’t known for the manufacturing prowess.
** A chart of Trade in Value Added (TiVA), as calculated by OECD, only supports the broad point. China’s value-added started to rise rapidly from 2004 on – even as the dominant narrative (in the U.S., at least) was still shaped by flawed Apple iPhone knockdown studies. The flaw in these studies, of course, was using the nationality of the firm providing the component as a proxy for manufactured value-added. The iPhone was also not typical.
Creative Commons: Some rights reserved.
This work is licensed under Creative Commons Attribution-NonCommercial-NoDerivatives 4.0 International (CC BY-NC-ND 4.0) License.
View License Detail