 Online Store
Introduction
Over the last several decades, governments have collectively pledged to slow global warming. But despite intensified diplomacy, the world is already facing the consequences of climate…

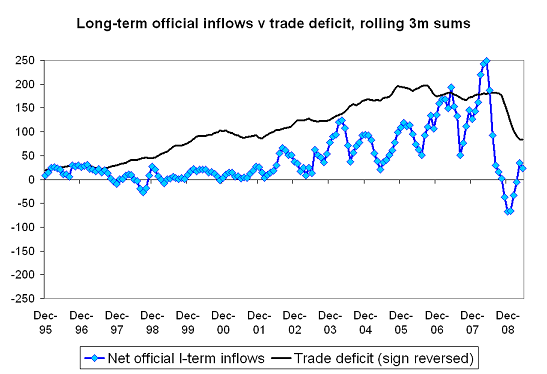
And now, the rest of the story: long-term portfolio flows have fallen by more than the trade deficit
More on:
The goods news: the US trade deficit has shrunk. On a rolling 12m basis the trade deficit is down to around $500 billion, and the data from the last few months suggests that it should fall even further.
The bad news: the US trade deficit hasn’t shrunk by as much as foreign demand for US long-term assets.
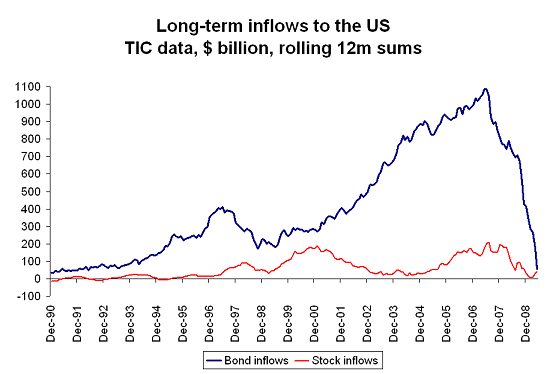
My graph only showed inward portfolio flows. That isn’t the entire balance balance of payments. But inward and outward FDI flows tend to offset each other. And in general Americans have been adding to their foreign portfolio, not reducing their foreign holdings. That means the (remaining) deficit is increasingly financed by short-term flows, which isn’t the most comfortable thing in the world.
All this is pretty clear if you look at the details of the last TIC data release (already covered in depth by Rachel). Over the last three months, private investors reduced their US holdings by over $100 billion (line 31). That total was offset by the repayment of the Fed’s swap lines -- but the long-term flow picture isn’t great. Net portfolio inflows over the last 12ms totaled $188 billion (line 19). After adjusting for repayment of ABS, that total falls to zero (lines 20 and 21).
As the following graph shows, net private demand for long-term US assets -- that is gross long-term private portfolio inflows net of US portfolio outflows -- started to disappear in late 2006, and then took another down leg after the subprime crisis broke in August 2007. And over the last 9 months, official demand for US long-term bonds also disappeared -- as reserve growth slowed (until recently) and central banks moved in mass toward short-term treasury bills.
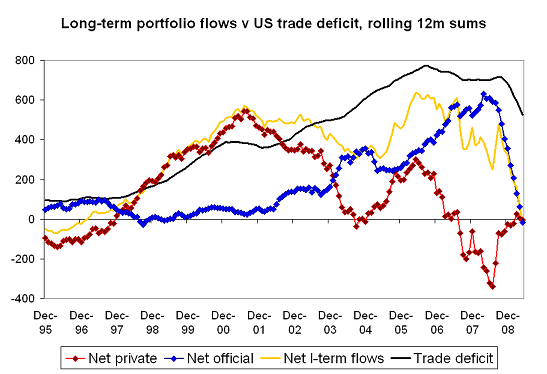
The split between official and private flows in the chart reflects my adjustments to the TIC data – but my adjustments basically just make the TIC data match the US survey data and the revised BEA data on official flows.* My adjustments change the official/ private split, but not the total.
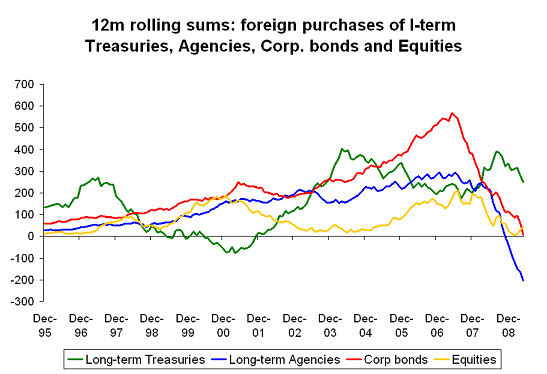
The usual narrative would argue that the fall in demand for US long-term assets is a reflection of foreigners concerns about the scale of the US fiscal deficit. That though isn’t really the case. Demand for long-term Treasuries has held up better than demand for almost all other kinds of US assets. The reality is that the rest of the world has lost confidence in claims on the US private sector, not in claims on the US government. Consider the following chart …
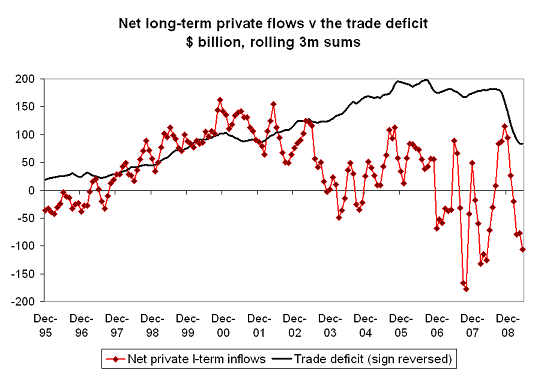
The higher frequency data tells a similar story. Net (private) demand for US long-term financial assets (private demand for US long-term assets from the rest of the world, net of US purchases of long-term foreign assets) hasn’t been strong for some time. It picked up in the crisis, as flows contracted in a way that favored the US. Americans sold their foreign portfolio faster than the rest of the world sold their US portfolio. But as the crisis has abated, net private demand for US assets has fallen off. Foreign demand for long-term US assets remains weak – and over the last few months Americans resumed buying foreign assets.
Incidentally, this chart is one of many that suggests, at least to me, that the US could not have sustained large deficits over the past few years if the US had been forced to finance its deficits in the private markets. The demand wasn’t there. Not on the scale that was needed. **
For a while, official purchases of long-term assets offset weakness in private demand. But after the crisis, risk-adverse reserve managers have preferred short-term bills – so demand for long-term US assets from central bankers largely disappeared.
There are some tentative signs that central banks are once again buying Treasury notes, at least short-dated ones. My estimates suggest that official purchases of long-term US financial assets are trending up again -- largely because of purchases of Treasuries through London.***
Even so, there was -- at least in the three months to May -- still a sizable gap between net demand for US long-term financial assets and the US trade deficit. The (much reduced) trade deficit is being financed by short-term inflows, and specifically short-term official inflows.
That isn’t ideal. The "quality" of the financing of the US deficit has gone down.
The fall in the trade deficit has, in my view, reduced the risk of a disruptive dollar adjustment -- at least relative to the pre-crisis world where the slow growing US was running 6% of GDP or so current account deficits, deficits that private investors showed little sign of wanting to finance. Analysts who emphasize the rise in the fiscal deficit tend to ignore the (even bigger) fall in private sector borrowing and corresponding fall in the United States total external financing need. But finding the financing to cover a period of adjustment is never easy; the US isn’t yet out of the woods.
* Using the methodology described in my work with Arpana Pandey, I attributed some of long-term Treasury and Agency purchases through the UK (and for Agencies, Hong Kong) to official buyers on an ongoing basis. This avoids the jumps characteristic of the annual survey revisions. I also adjusted official equity purchases for Chinese purchases through Hong Kong from 2005 on, using a similar methodology. There was a big jump in Hong Kong’s equity purchases in early 2007, and the survey data subsequently attributed those purchases to China. The overall data should be fairly close to the BEA’s revised data series – though I didn’t adjust official purchases of corporate bonds down to reflect the survey revisions (apparently central banks do not use US custodians for this exposure), as I suspect that the data actually understates the official sector’s true exposure to corporate credit. Private fund managers did a lot of things to get a bit of extra yield, and some central banks made increasingly use of private fund managers when they themselves were reaching for a bit of yield.
**A counter argument is that official demand displaced private demand, but didn’t change the overall equilibrium. This has two components. First, if say China’s government hadn’t been building up claims on the US and Europe, private Chinese investors would have bought the same amount of US and European assets (something I don’t believe). And second, if say China had bought more European assets and fewer US assets, private investors in Europe would have shifted funds from Europe to the US – keeping the US deficit up. That argument has a grain of truth, but it assumes a bit more substitutability between US and European assets (including a willingness to take unhedged currency risk) than I suspect is present in the market.
*** The UK’s Treasury holdings rose by about $30 billion over the last three months.
More on: